By Harry Ryalls (BSAC OWI1627)
 Have you ever sat watching the waves lap the shoreline and wondered what is happening? What allows the water to do that? How do tides come and go? Why do some places in the world have no tides at all? What are tides anyway? Well read on and I hope you will have a better understanding when you finish.
What are Tides? What’s a current? Here’s the technical bit.
Tides are the vertical rise and fall of the oceans of the world. Tidal currents are the horizontal movement of the water caused by these tides. Tides can be described as the alternating rise and fall of sea level with respect to land, as influenced by the gravitational attraction of the moon and sun.
Other factors influence tides; coastline configuration, local water depth, seafloor topography, winds, and weather alter the arrival times of tides, their range, and the interval between high and low water.
Predicted tidal heights are those expected under average weather conditions. When weather conditions differ from what is considered average, corresponding differences between predicted levels and those actually observed would occur.
Generally, prolonged onshore winds (wind towards the land) or a low barometric pressure can produce higher sea levels than predicted. Whilst offshore winds (wind away from the land) and high barometric pressure can result in lower sea levels than predicted
The world’s oceans are in constant flux. Winds and currents move the surface water causing waves. Ocean levels fluctuate daily as the sun; moon and earth interact with each other. As the moon travels around the earth and as they, together, travel around the sun, the combined gravitational forces cause the world’s oceans to rise and fall.
 Imagine the earth covered completely by water. As the earth spins, this water is balanced evenly on all sides by centrifugal force. The moon has a gravitational pull on this layer of water as it orbits the earth. This pull causes the water to bulge toward the moon. Because the earth is spinning there will be a bulge on the opposite side of the earth as well.
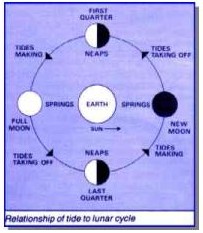
As the earth rotates on its axis, each location on the earth will experience both tidal bulges. The areas of high water levels are high tides and the areas of low levels are low tides. Since the earth and the moon rotate around the sun, there is an added modifying factor. When the sun and moon are aligned, there are exceptionally strong gravitational forces. These cause very high and very low tides, which are called spring tides, though they have nothing to do with the season. When the sun and moon are not aligned, the gravitational forces cancel each other out. The tides are not as dramatically high or low. These are called neap tides. Spring tides and neap tide levels are about 20% higher or lower than the average height. Tides vary from day to day, as the earth, moon, and sun orbit, their positions constantly shift, causing slightly different gravitational effects. This causes the tides to occur at slightly different times. Tides also vary from place to place. Geographical position determines the level of tide. In Northern California there are two unequal tides each day. In the Gulf of Mexico there is only one high tide and one low tide each day.
All bodies of water have tides. Most people don’t think lakes have tides, because the tides are so small. In the open ocean the tides are relatively small (about 2 or 3 feet). When the ocean waters meet land, the tides become larger, especially in bays and harbours. In our area of the world we have, on average, two high and two low tides and the corresponding floods and ebbs of these tides each day. Our tides change about every 6 hours 13 minutes; with a full tidal cycle in about 12 hours and 30 minutes. Each day the high tide is about an hour later as it takes the moon approximately 24 hours and 50 minutes to completely rotate around the earth.
To find the rates of tidal streams, either consult the chart Tidal Diamonds or use special Tidal Stream Atlases and Pilot Books which include diagrams showing the tidal streams for a given area, all related to times before or after High Water at the nearest appropriate port.
 Here’s another thought about tides? How do you know what the height of the tide will be at any particular time?
We can find out when High Water and Low Water occur by listening to the weather reports.
But you may need to know more.
There are two methods for obtaining the tide height at anytime throughout its cycle. One makes use of a’Tidal Curve’ and it is preferred where you need to be as accurate as is possible with-in the constraints of the inaccuracies inherent in the tidal data e.g. A change in the barometric pressure or an alteration in wind direction/force will change the time or rise/fall of a tide. The second is known as the ’Rule of Twelfths’ and can be calculated entirety without too much stress! It is however not as accurate as using a ’Tidal Curve’ and should be used with caution! The ’Rule Of Twelfths’ is based on the assumption that the tide follows a symmetrical flow pattern during a 12-hour cycle between successive high waters, the rule nevertheless provides enough accuracy for most sailors. To use the rule, you only need to know the time and height of either high or low water together with the range for that tide. Finally, to get the depth of water in any spot at a certain time, you need only add the charted depth to that figure for height of tide.
Here’s the technical bit again.
 The following calculations are based on the assumption that the tide rises and falls in the same pattern.
In open water this is probably true but does not hold good for constricted areas, such as the Solent area and many other Harbours. It follows that the answers should be treated as approximate and treated with caution.
The level of water does not rise or fall at a constant rate throughout the duration of a flood or ebbing tide. The amount by which it will do so can be estimated mentally by means of the following rough guide:
This rule states that the tide will increase by one twelfth of its range during the first hour after low tide, by two additional twelfths during the second hour after low tide, and by three additional twelfths during the third hour after low tide etc., etc.
Here is a table showing the hourly change information .
| The Rules of Twelfths | ||||||
| 1 Hours of Tide Cycles | 1 | 2 | 3 | 4 | 5 | 6 |
| Hourly Rise | 1/12 | 2/12 | 3/12 | 3/12 | 2/12 | 1/12 |
| Cumulative Rise | 1/12 | 3/12 | 6/12 | 9/12 | 11/12 | 12/12 |
| Percent of Rise | 8% | 16% | 25% | 25% | 16% | 8% |
As you can see from the table, in the 3rd & 4th hour of the tide cycle, the tide height rose 50% of its total height. As previously stated, this rule is only a rough approximation, as both Wind and adverse weather conditions can affect the tides as well.
To determine when it is high/low tide and when the flood/ebb starts, use a tide or current table. We can use a variety of publications to obtain this information, from an expensive almanac to a cheap or if luck free tide tables from our local shop. If we look at the information for a particular date we would see something like the information contained below. This is the tide height above Chart Datum and the time that height occurs on that particular date. Using this we can calculate the ’Rules of Twelfths’ and the height of the tide at any particular time of that day.
When looking at tide predictions, watch out for daylight saving time. Do the tide predictions adjust for daylight saving time? Some play out their predictions only in standard time such as Greenwich Mean Time, so be sure to adjust accordingly if the predictions are in GMT. Daylight savings (British Summer Time) starts around the last Sunday of March or the first Sunday in April and ends on the last Sunday in October. If the dates fall between the end of March and the end of October, 1 hour will have to be added to the times given, therefore 10:00am May 4th (BST) is really 09:00am GMT
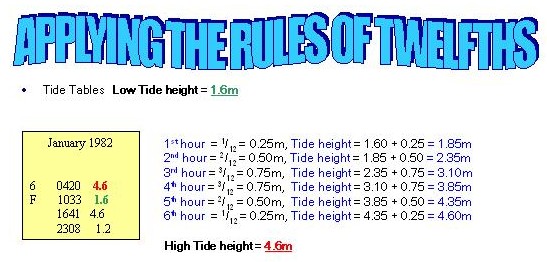
The tidal information shown below is for Friday 6th January 1982 and is typical of the type of information given within tide table. There are two tides on that day and it can be seen that the second low water (1.2m) tells us that we are heading away from neaps and towards spring tides as the height difference is increasing. It is 3.0m (4.6-1.6) in the morning and 3.4m (4.6-1.2) in the afternoon. If we use the information for the morning tides we can calculate the tide height for each hour between high and low water.
Tidal Range = 4.6 – 1.6 = 3.0 meters
1/12 Tidal Range = 3.0 / 12 = 0.25 meters
 This method of calculating the Rules of Twelfths and the Tide Height can get very messy as it entails lots of calculations and therefore mistakes during these calculations can easily be made. Another method of calculating Tide Height is to use a Tide Flow Curve for the area you are interested in. This chart shows us the TIDAL FLOW RATE for both spring and neap tides at a particular harbor that is of interest or close to an intentional area of interest.
Now to the second method of obtaining tidal heights
An explanation of the Tidal Curves.
 For most tide tables the tides can also be characterized by a tidal curve. A ’Tidal Curve’ substitutes ’The Rule of Twelve’and is used when you need tide heights to be as accurate as is reasonable possible within the constraints of the tidal data supplied. It is an interpolation of the tides flow and ebb, plotting the varying rise and fall of tide throughout its daily cycle. The left side contains the water height information with the lowest heights to the left where also the chart datum is indicated. The low water height will be marked at the bottom and the high water height will be marked at the top. The area under curve is for time information. To find the water height at a specific time of the day we need to know first how many hours before or after the High Water this is. The ’Legend Box’ indicates mean ranges for both spring and neap tides.
Now to the technical bit again.
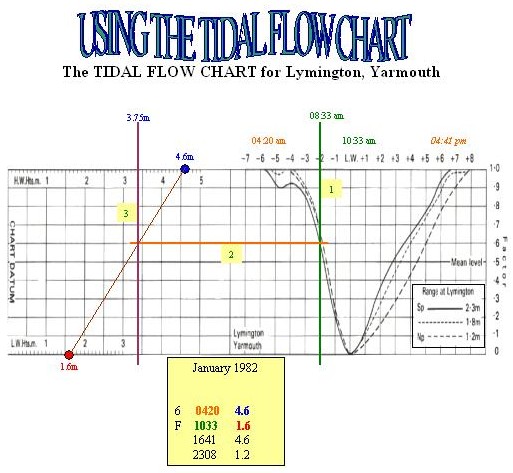 Using the same tidal information we used for the rules of twelfths we can easily determine the height of the tide at anytime during its ebb and flow for either Spring tides (Sp) or Neap tides (Nap). Our LOW WATER HEIGHT is 1.6m above chart Datum (CD); this is marked on the bottom left scale of the chart, our HIGH WATER HEIGHT is 4.6m above CD; this is marked on the top left scale of the chart.
We then draw a line that passes through BOTH these marks, once we have done this it now becomes theTIDE HEIGHT CHART for that area.
From the TIDE TABLES it can be seen that Low water occurred at 10:33 am, this information is also transferred to our chart, this time on the right at the LW. Position, similarly the HW times can be added either side of the LW time.
Now to calculate the height of the tide for any time between either of the high water times (04:20am – 04:41pm) for Friday 6th January 1982, all that is need is a pencil and a straight edge (a rule would be ideal). What is then needed to be done is to drop a vertical line down from that time till it dissects the tide flow rate graph for either springs or neaps. In this instance a vertical line (1) is dropped from the 08:30 mark till it cuts the spring tide graph. Where that line cuts the graph, a parallel line (2) is drawn across to the TIDE HEIGHT CHART, where this cuts the chart line is then transferred (3) by another vertical line, either up or down, till it cut the tide height scale. The height of the tide can then be read directly off the scale.
From this example it can be seen that at 08:33am, 4 hours after high tide, on Friday 6th January the tide height at Lymington, Yarmouth was 3.85m above chart datum for the Spring Tide. This is the same value as that calculated by using the ’Rules of Twelfths’ in the previous example for 4 hours after Low Water.
To interpolate between spring and neap tides we use the Rule of Seven. Since the change from spring range to neap range can be assumed linear (instead of sinusoid), each day the range changes with 1/7th of difference between the spring and neap ranges. Hence, the daily change in range is (spring range – neap range)/7.
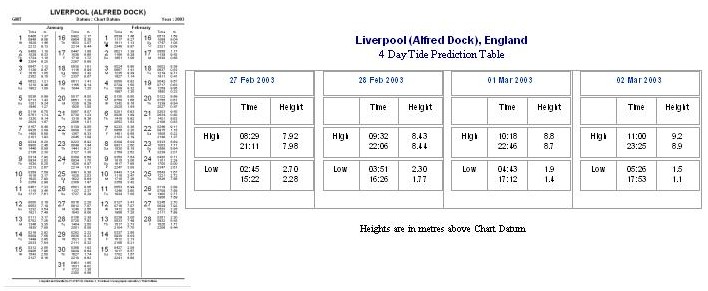
 Instead of mere averages or mean height, a tide table provides us with the times of high and low water each day for a particular place. Basically, it is the same table like the one we used in the examples, but is extended for every day in a year. By using this method we get more accurate water heights since it involves less interpolation. The example shows us a part of a very detailed tide table for Liverpool Alfred Dock for February 2003. It is a part of a table, which shows the high and low water heights and times for the whole month.
So Tide Tables are a listing of predicted tide heights for a given area for a given date and time. These are available for all the Major Ports, Secondary ports and Harbours of the United Kingdom and other places of the world. They can be obtained from a variety of sources, from very expensive almanacs to free issue ones supplied from various retailers. With modern technology, you can even find them on the World Wide Web.
 No matter what you use or how you obtain the information you require, there are some things you need to be wary of. These can cause small errors but these could also be catastrophic errors as well.
Some of these errors are only tiny, but if they all happen to stack up together, they can be significant.
![]() Using the wrong port information! Yes it happens.
Using the wrong port information! Yes it happens.
![]() Using the wrong tidal curve
Using the wrong tidal curve
![]() The wrong day!
The wrong day!
![]() GMT and BST mix-ups.
GMT and BST mix-ups.
![]() Using LW time instead of HW.
Using LW time instead of HW.
![]() Misunderstanding the scale on the tidal curve.
Misunderstanding the scale on the tidal curve.
![]() Blunt pencils!
Blunt pencils!
![]() Not using a straight edge.
Not using a straight edge.
![]() Changes in chart datum in short steep rivers.
Changes in chart datum in short steep rivers.
I hope this report / article has been informative and helps with tidal predictions. I have enjoyed collating the information contained within this report and have learnt things myself whist doing it.


